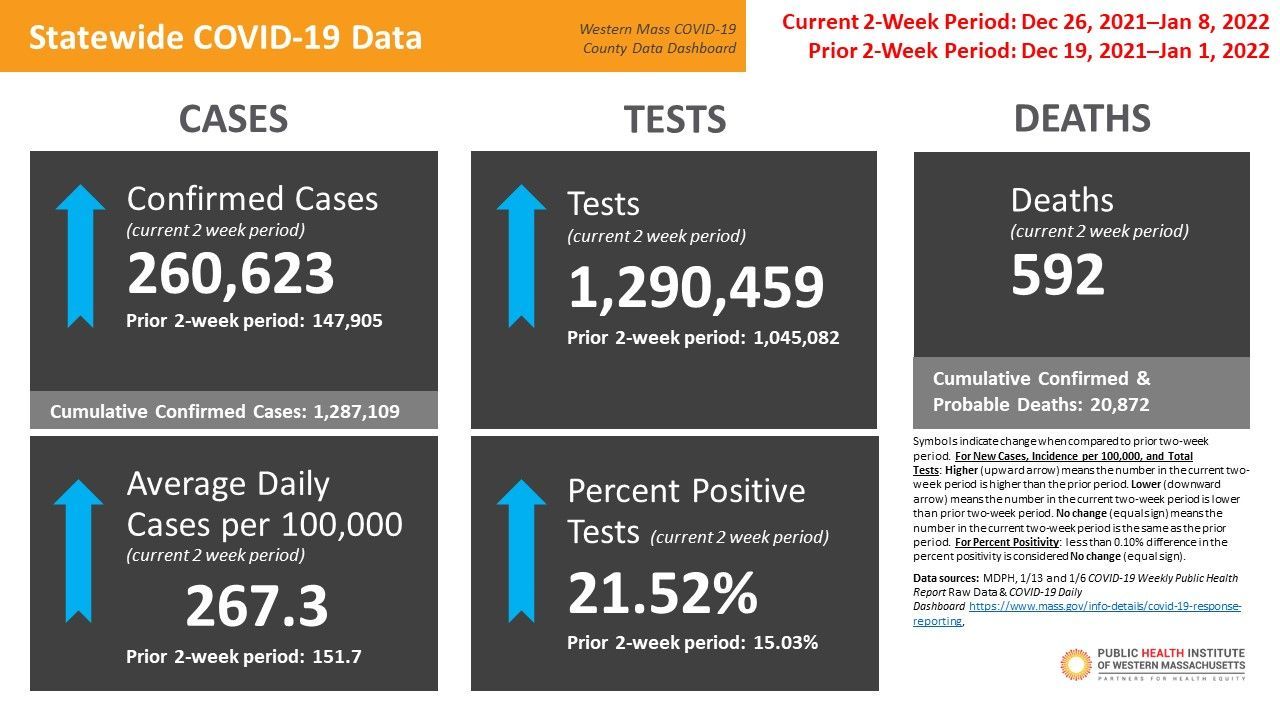
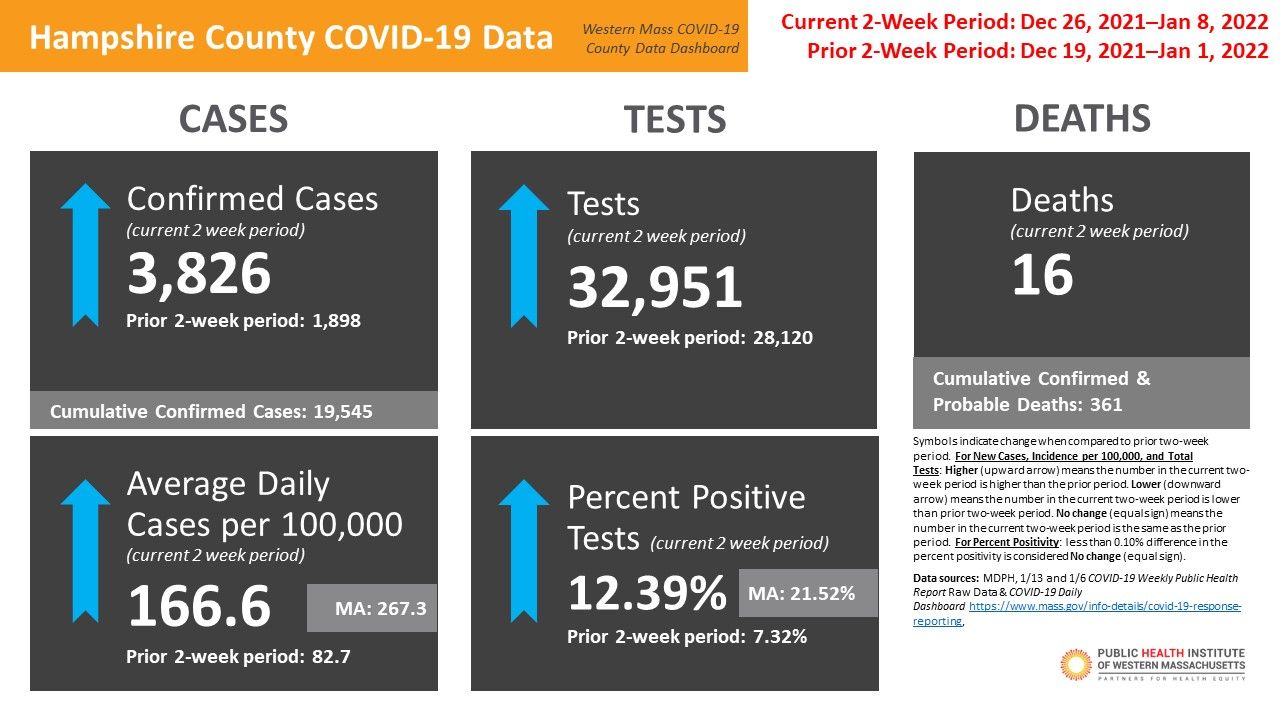
Western MA COVID-19 Data Dashboard
January 14, 2022
Based on best available data as of 1/13/2022


- Download a PDF of the Western MA COVID-19 County Data Dashboard
Community-Level COVID-19 Data Over Time
Based on best available data as of 1/13/2022
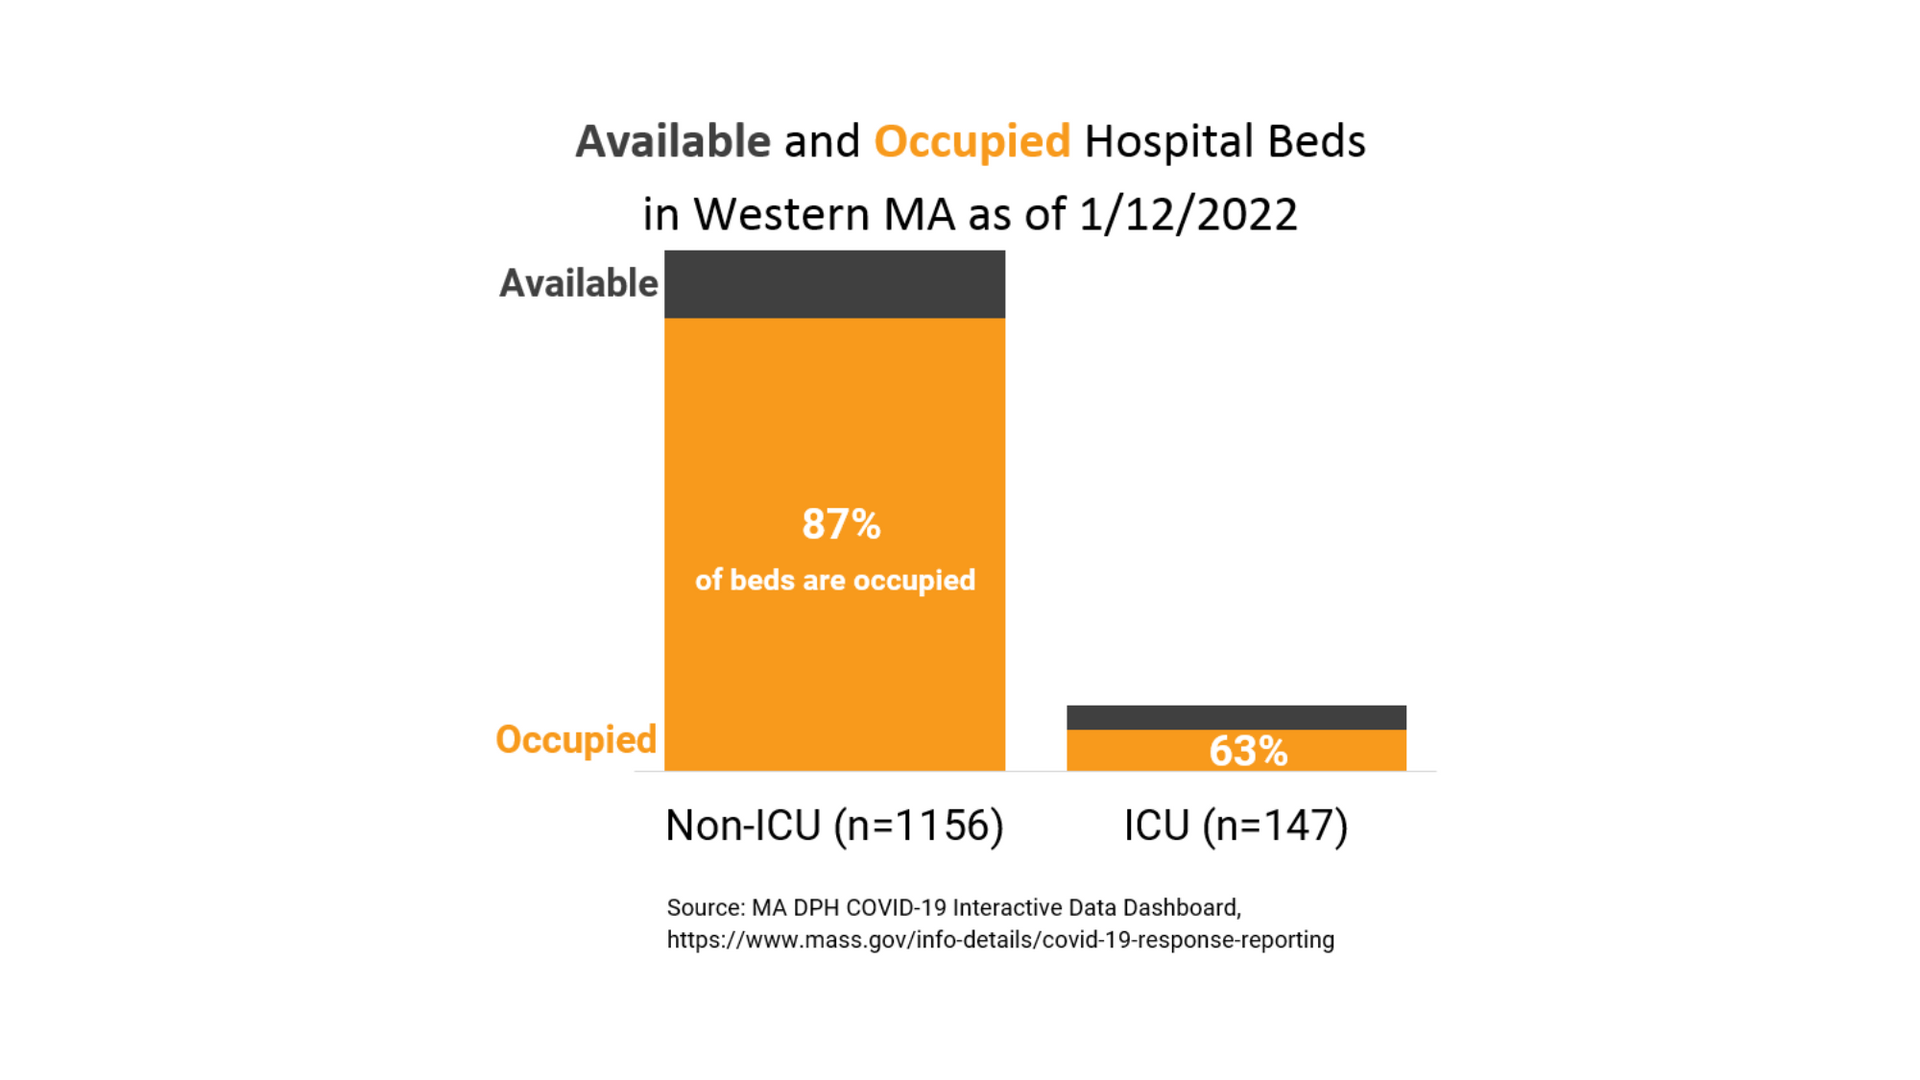
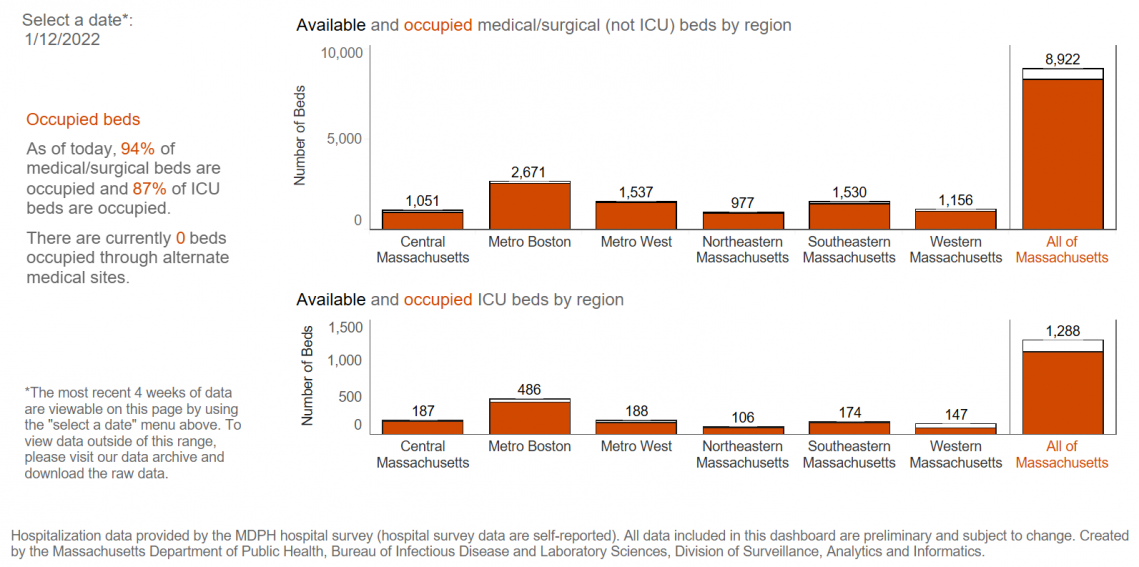
Hospital Capacity by Region
Based on best available data as of 1/13/2022
COVID-19 Vaccine
Based on best available data as of 1/13/22
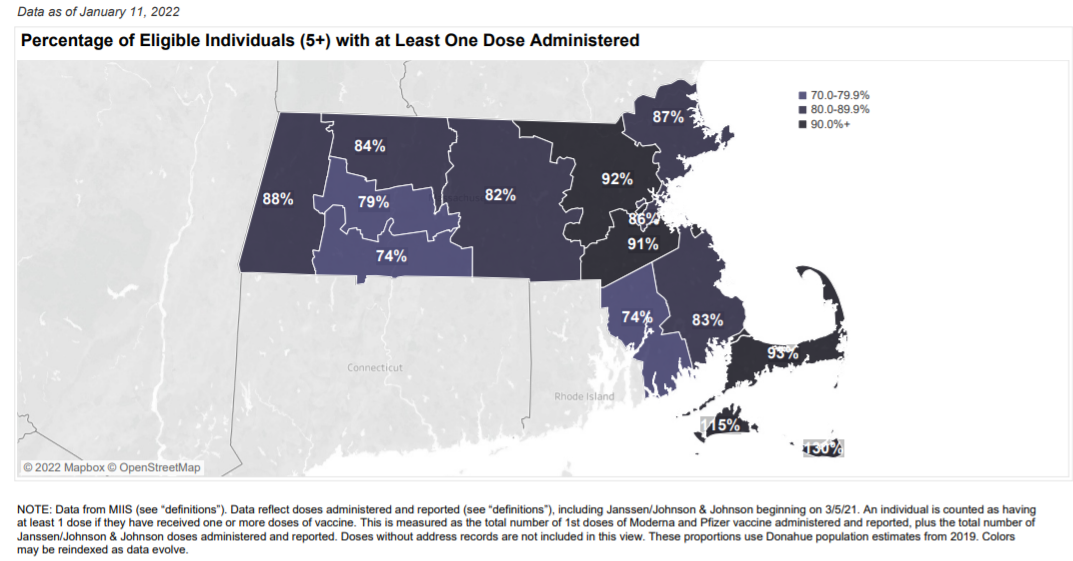
Percentage of Eligible Individuals (5+) with at Least One Vaccine Dose Administered by County of Resident Address
Percentage of Eligible Individuals (5+) Fully Vaccinated by County of Resident Address
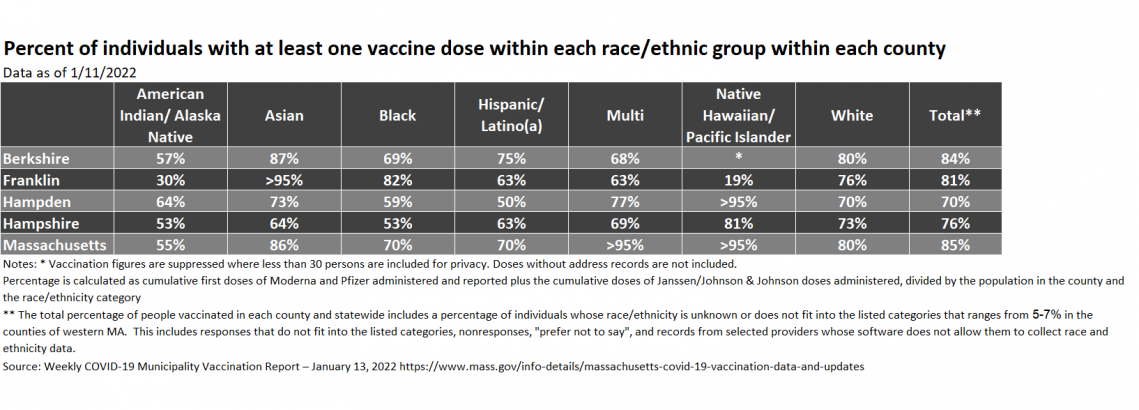
Percentage of All Individuals with at Least One Vaccine Dose within Each Race/Ethnic Group by County of Resident Address
Municipal Vaccine Data
- COVID-19 Vaccine Equity Initiative Data Dashboard: View vaccination data for select cities in MA.
- Massachusetts COVID-19 vaccination data and updates: View state, county, and city-level data, as well as updates about the COVID-19 vaccine in MA.
Data Sources and Notes
- Sources:
- MDPH Weekly COVID-19 Public Health Report. Current two week data is from most recent Public Health Report. Prior two week data is from prior week’s Public Health Report. Please note that there is an overlap in periods as MDPH reports weekly on rolling two week reporting periods, which they use for their comparisons. We report data in this way to be consistent with MDPH reporting.
- MDPH COVID-19 Daily Dashboard. Date corresponding to most recent MDPH Weekly COVID-19 Public Health Report.
- MDPH COVID-19 Interactive Data Dashboard
- MDPH Weekly COVID-19 Vaccination Report
- Comparisons to previous two-week period: Symbols indicate change when compared to prior two-week period. For new cases, incidence per 100,000, and total tests: Higher (upward arrow) means the number in the current two-week period is higher than the prior period. Lower (downward arrow) means the number in the current two-week period is lower than prior two-week period. No change (equal sign) means the number in the current two-week period is the same as the prior period. For percent positivity: less than 0.10% difference in the percent positivity is considered No change (equal sign).
- Race and ethnicity data by county and community is not available at this time.
Change in reporting: MDPH changed their reporting of county data on 8/12/20. Previously, county cases were in the Daily COVID-19 Dashboard report and included probable and confirmed cases. Beginning 8/12/20, county data is now reported in the Weekly COVID-19 report and cases only include confirmed cases. Thus, we are not currently able to show new case county-level data and other county-level data over time for periods prior to 8/12/20.
share this
Related Articles

Wanda Givens is a member of the leadership team for the Women of Color Health Equity Collective (WOCHEC). WOCHEC offers training and consulting services to address issues of white supremacy, health inequity, and more. As part of her work at WOCHEC, Wanda facilitates a training about cultural humility. "What I love most about facilitating Cultural Humility is not what people learn about each other, but what they learn about themselves. The more we know about how we get to be who we are, the more we can understand and relate to someone else’s journey. There’s nothing more rewarding than seeing someone come to the realization that they are more like others in the room than they are different. Our paths may take different roads, but essentially, we are all on the same journey." Did you know the Race and Health Equity Resource Guide includes a listing of organizations like WOCHEC who can help guide your organization on its anti-racism journey and more!
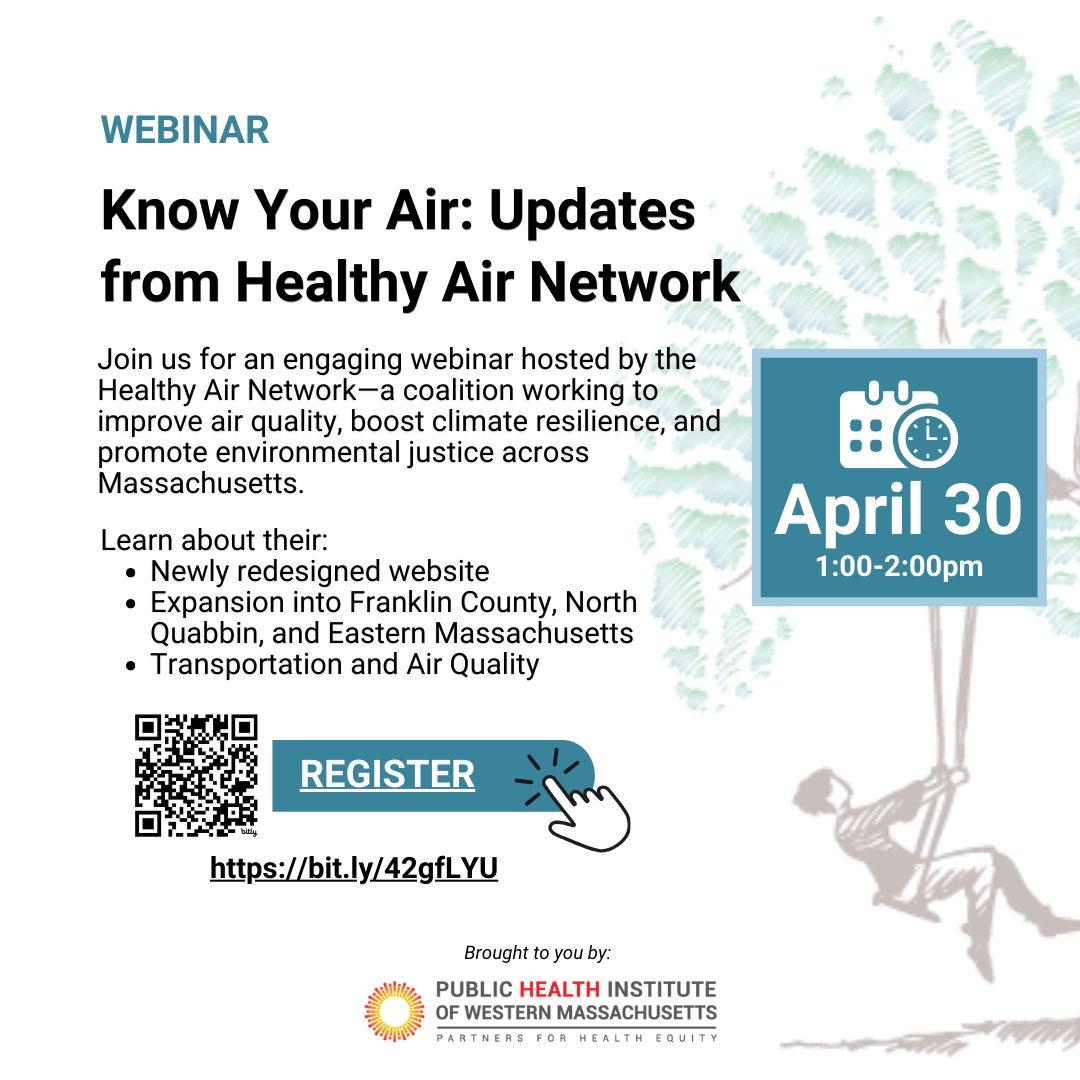
Join us for an engaging webinar hosted by the Healthy Air Network—a coalition working to improve air quality, boost climate resilience, and promote environmental justice across Massachusetts. Learn about their: Newly redesigned website Expansion efforts into Franklin County, North Quabbin, and eastern Mass Transportation work
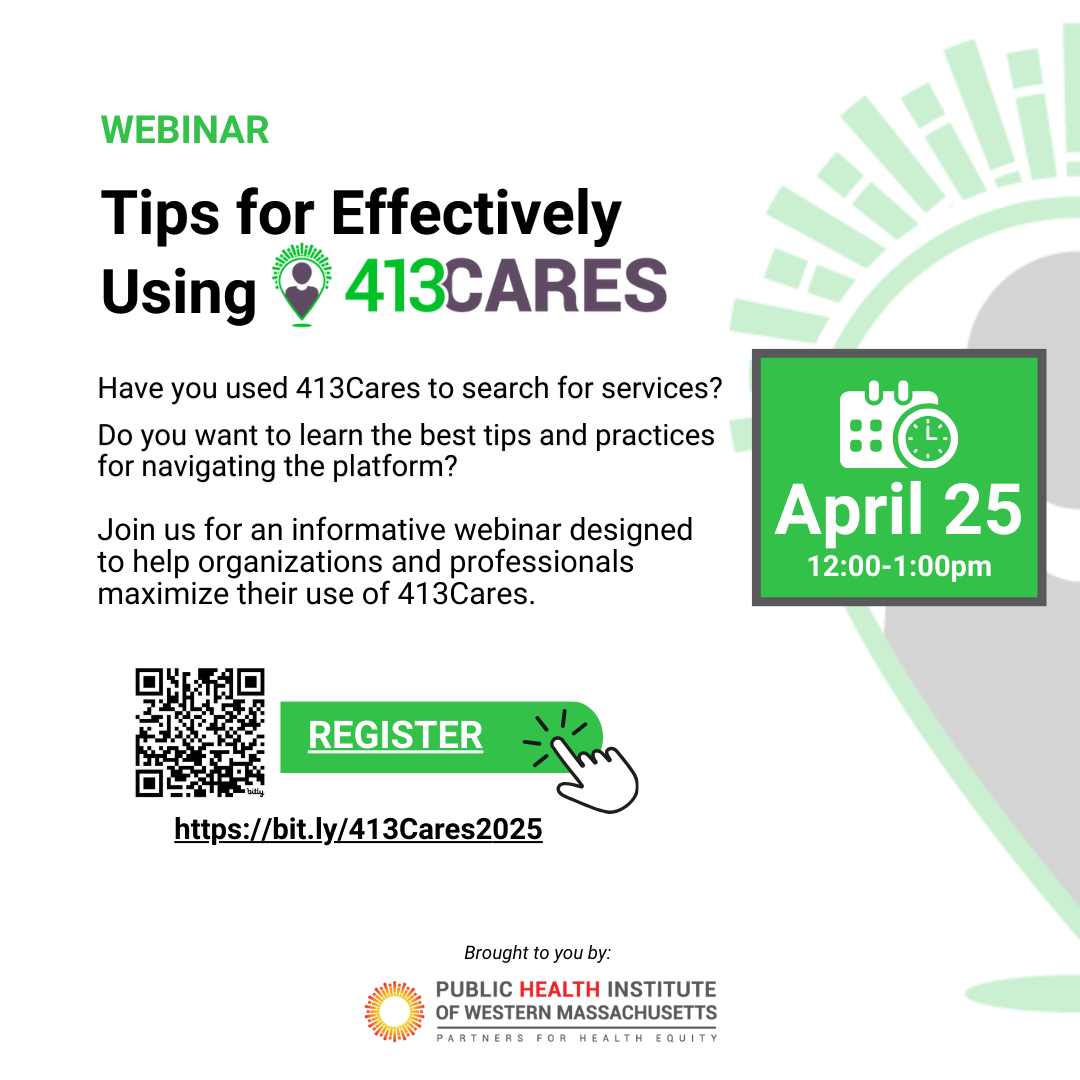
Have you used 413Cares to search for services? Do you want to learn the best tips and practices for navigating the platform efficiently? Join us for an informative session designed to help organizations and professionals maximize their use of 413Cares. This webinar is ideal for professionals who are newer to 413Cares, as well as those who have been using the platform and want to refine their search strategies and gain deeper insights. What You’ll Learn: Guidance for using 413Cares effectively Best practices for finding and accessing services Answers to common questions and tips